03/05QUANT · DATA · SOFTWARE
Ottometrix
We analyze. You decide.
A quantitative engine that ranks US stocks by how attractive they look twelve months ahead, and the SaaS built on top of it. I designed and built it end to end: the data pipeline, the statistical validation and the interface.
- ROLE
- Sole founder — engine, data, validation and product
- YEAR
- 2026
- STATUS
- In development · private
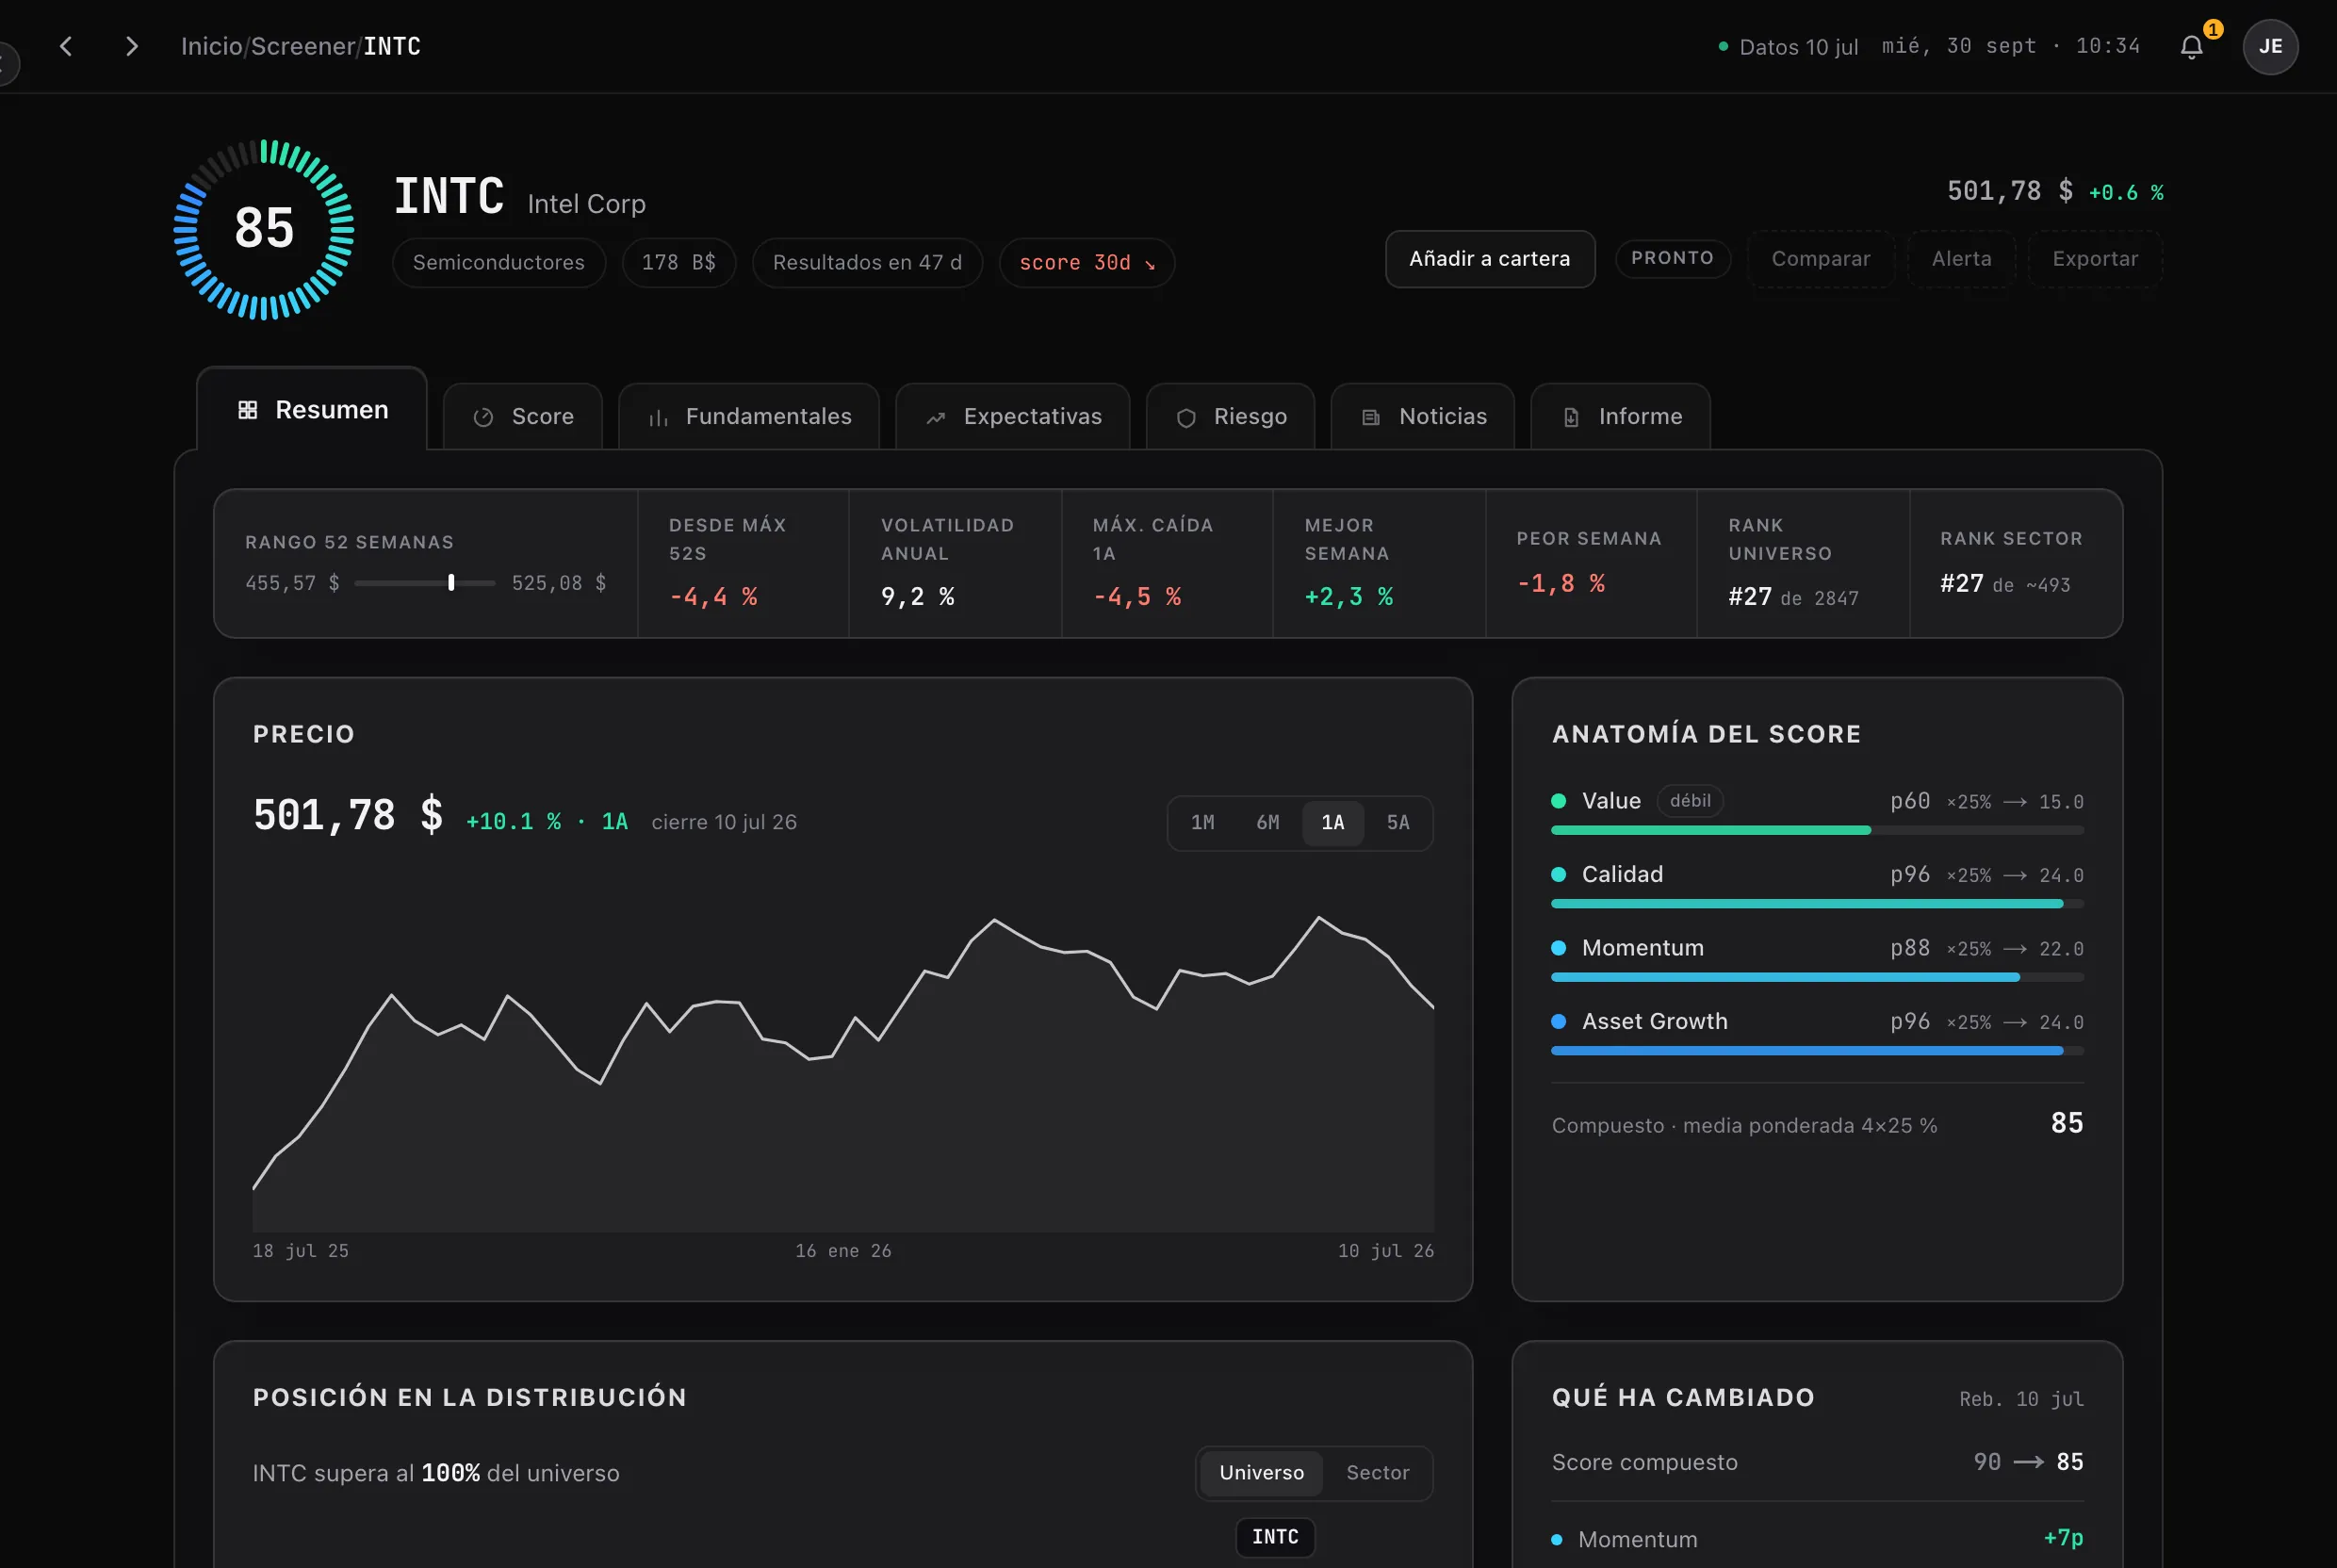
- 1Composite score of the stock, 0–100
- 2Seven modules, one question each
- 3Price over the last year, with its ranges
- 4Anatomy of the score: each factor’s percentile × 25 %
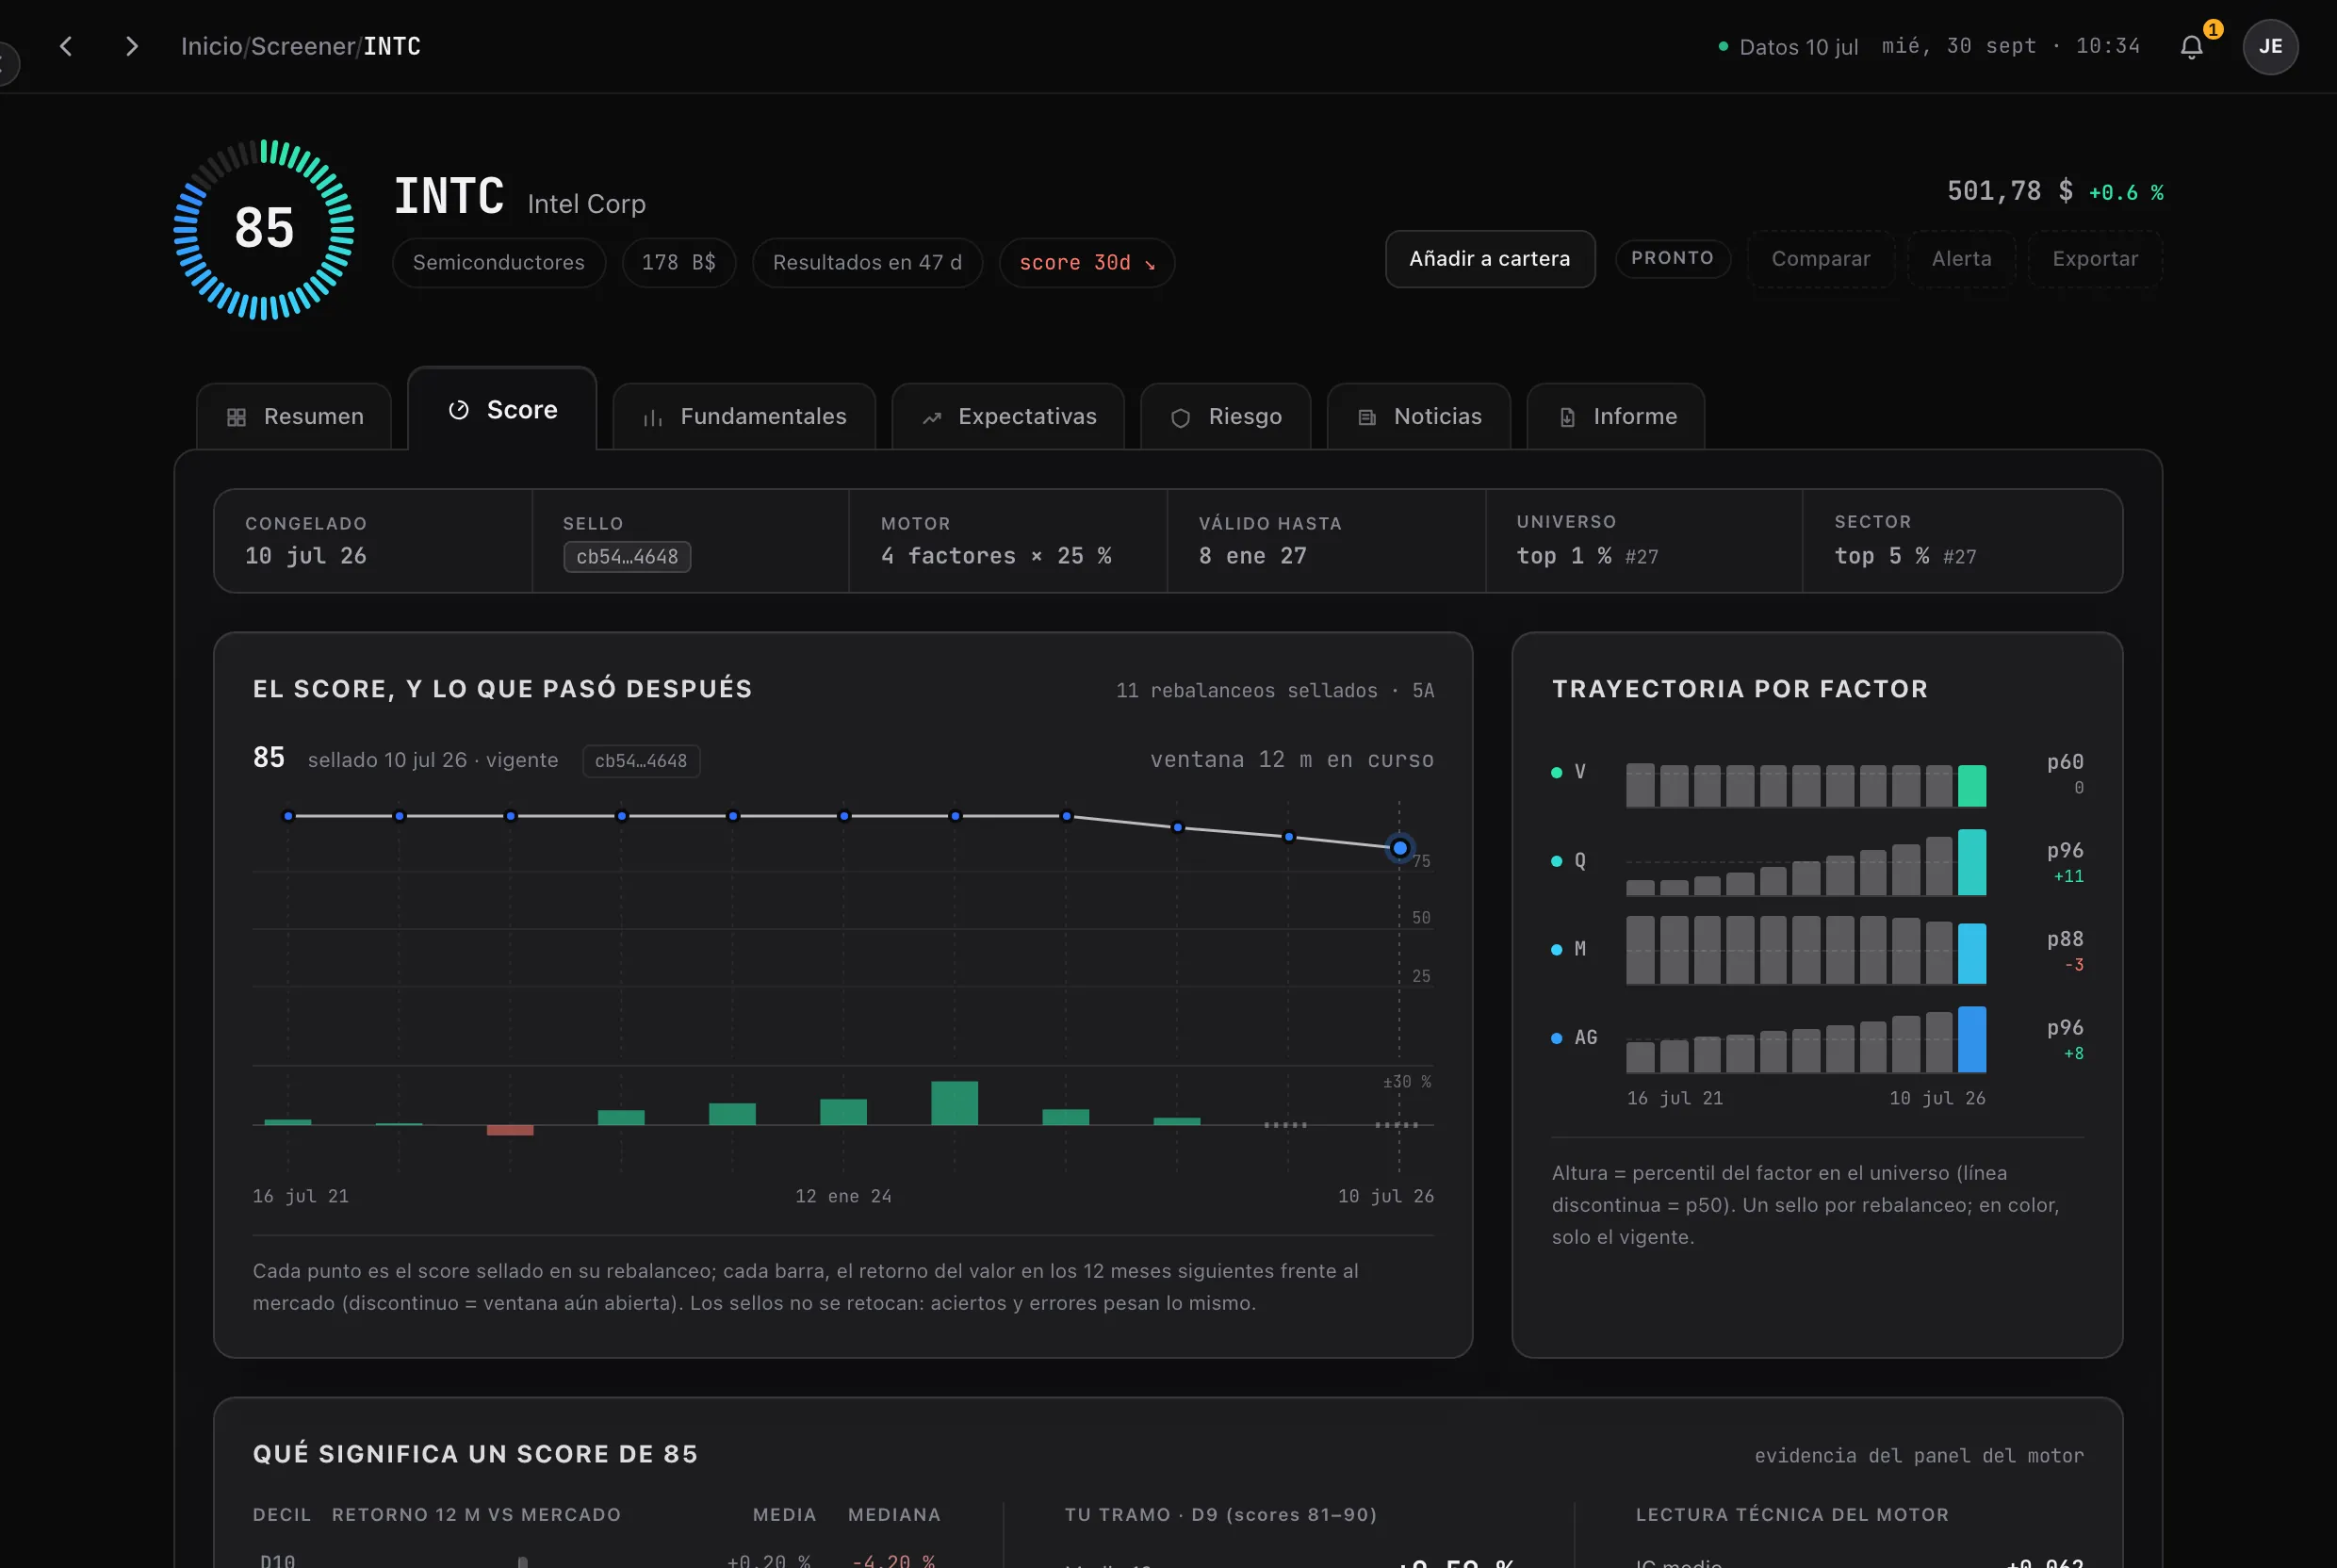
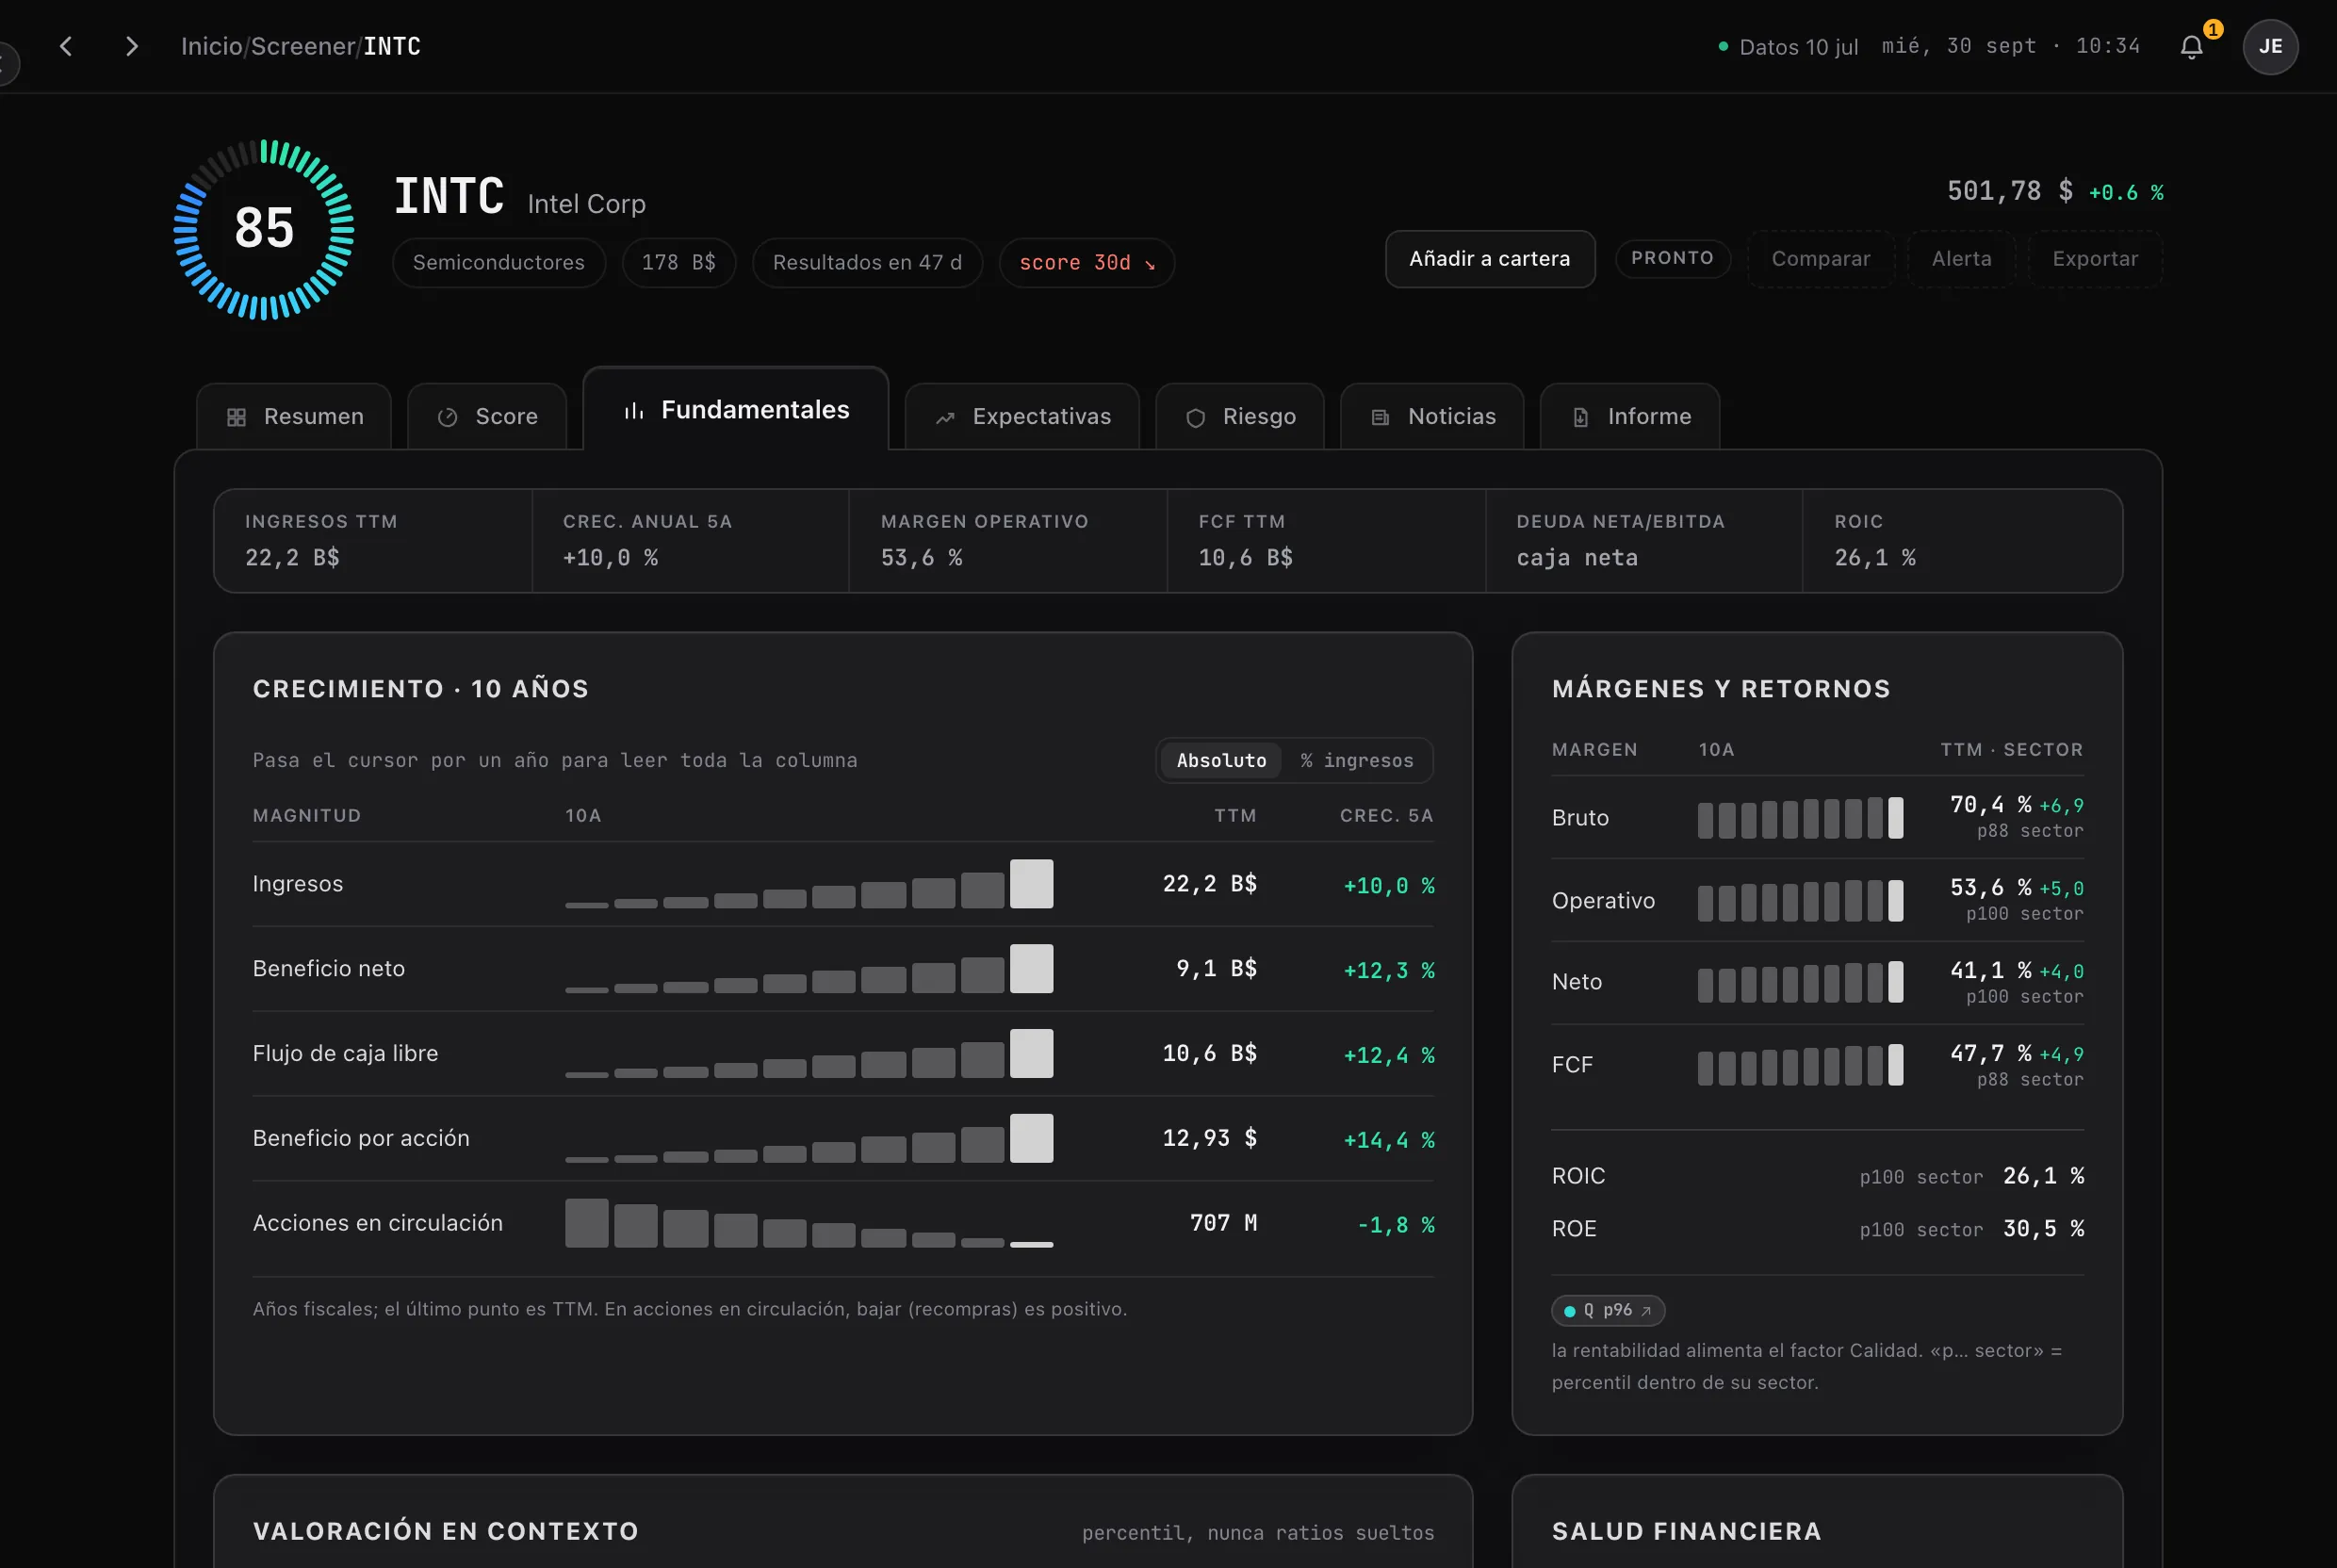
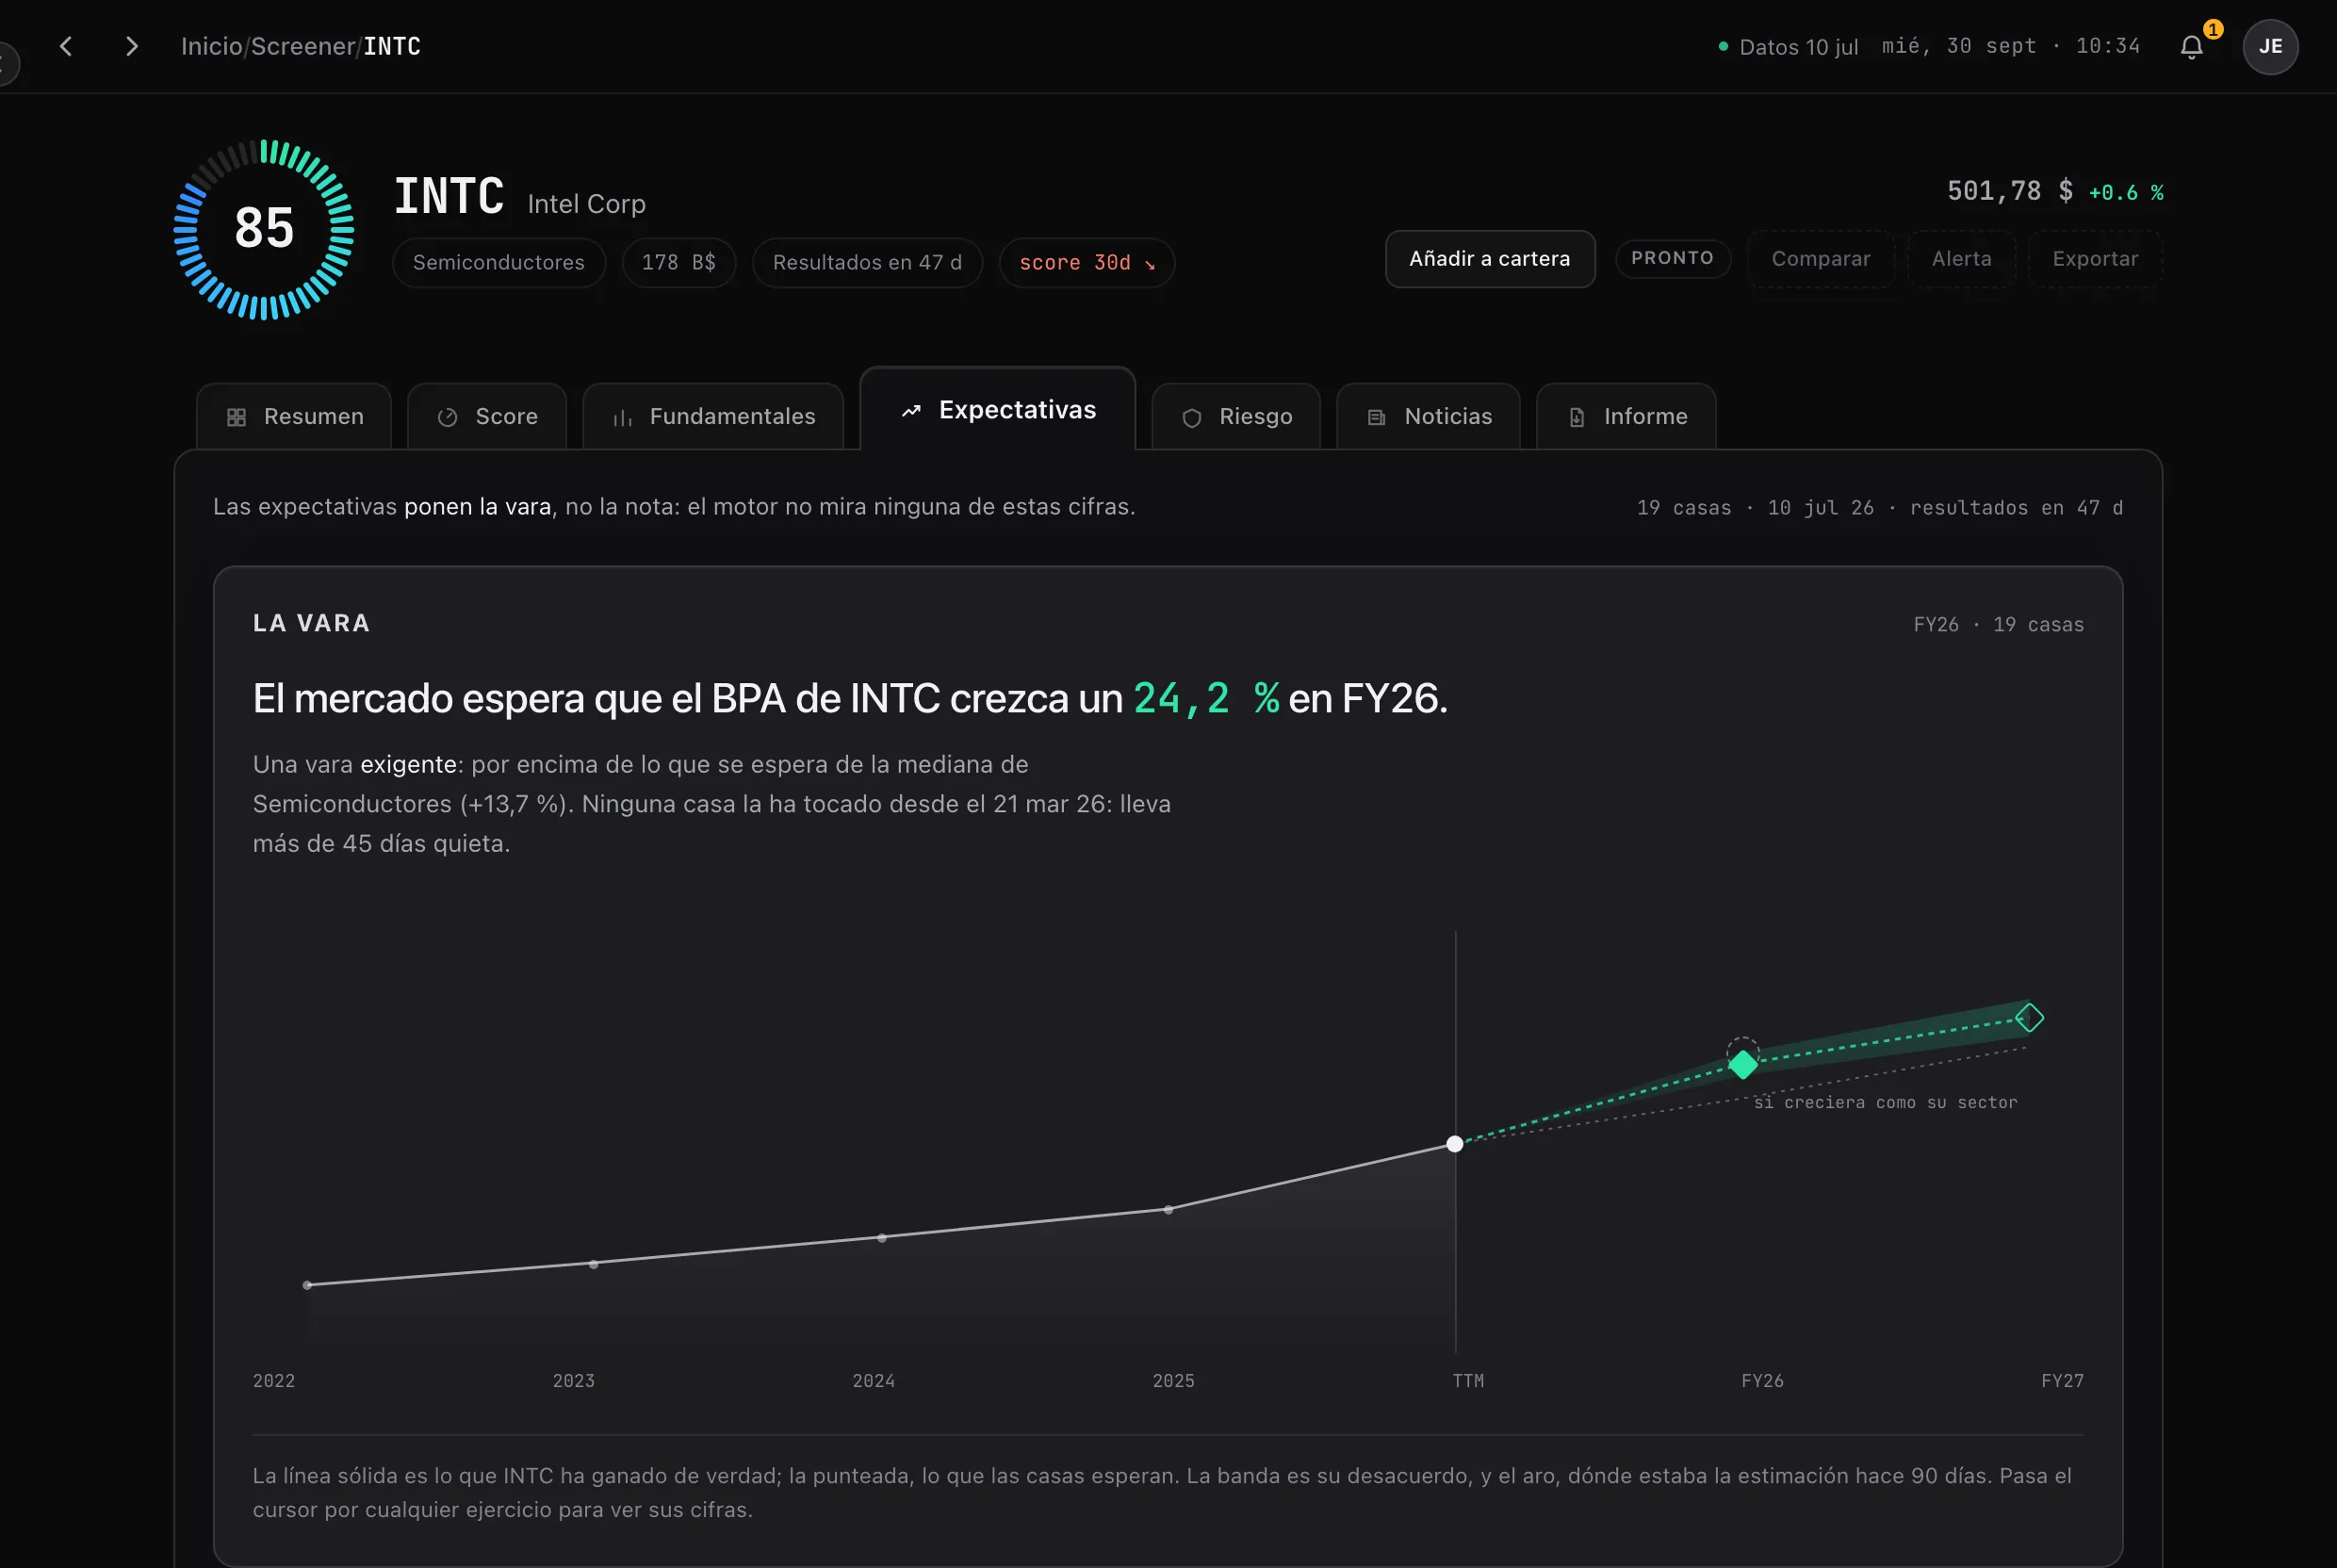
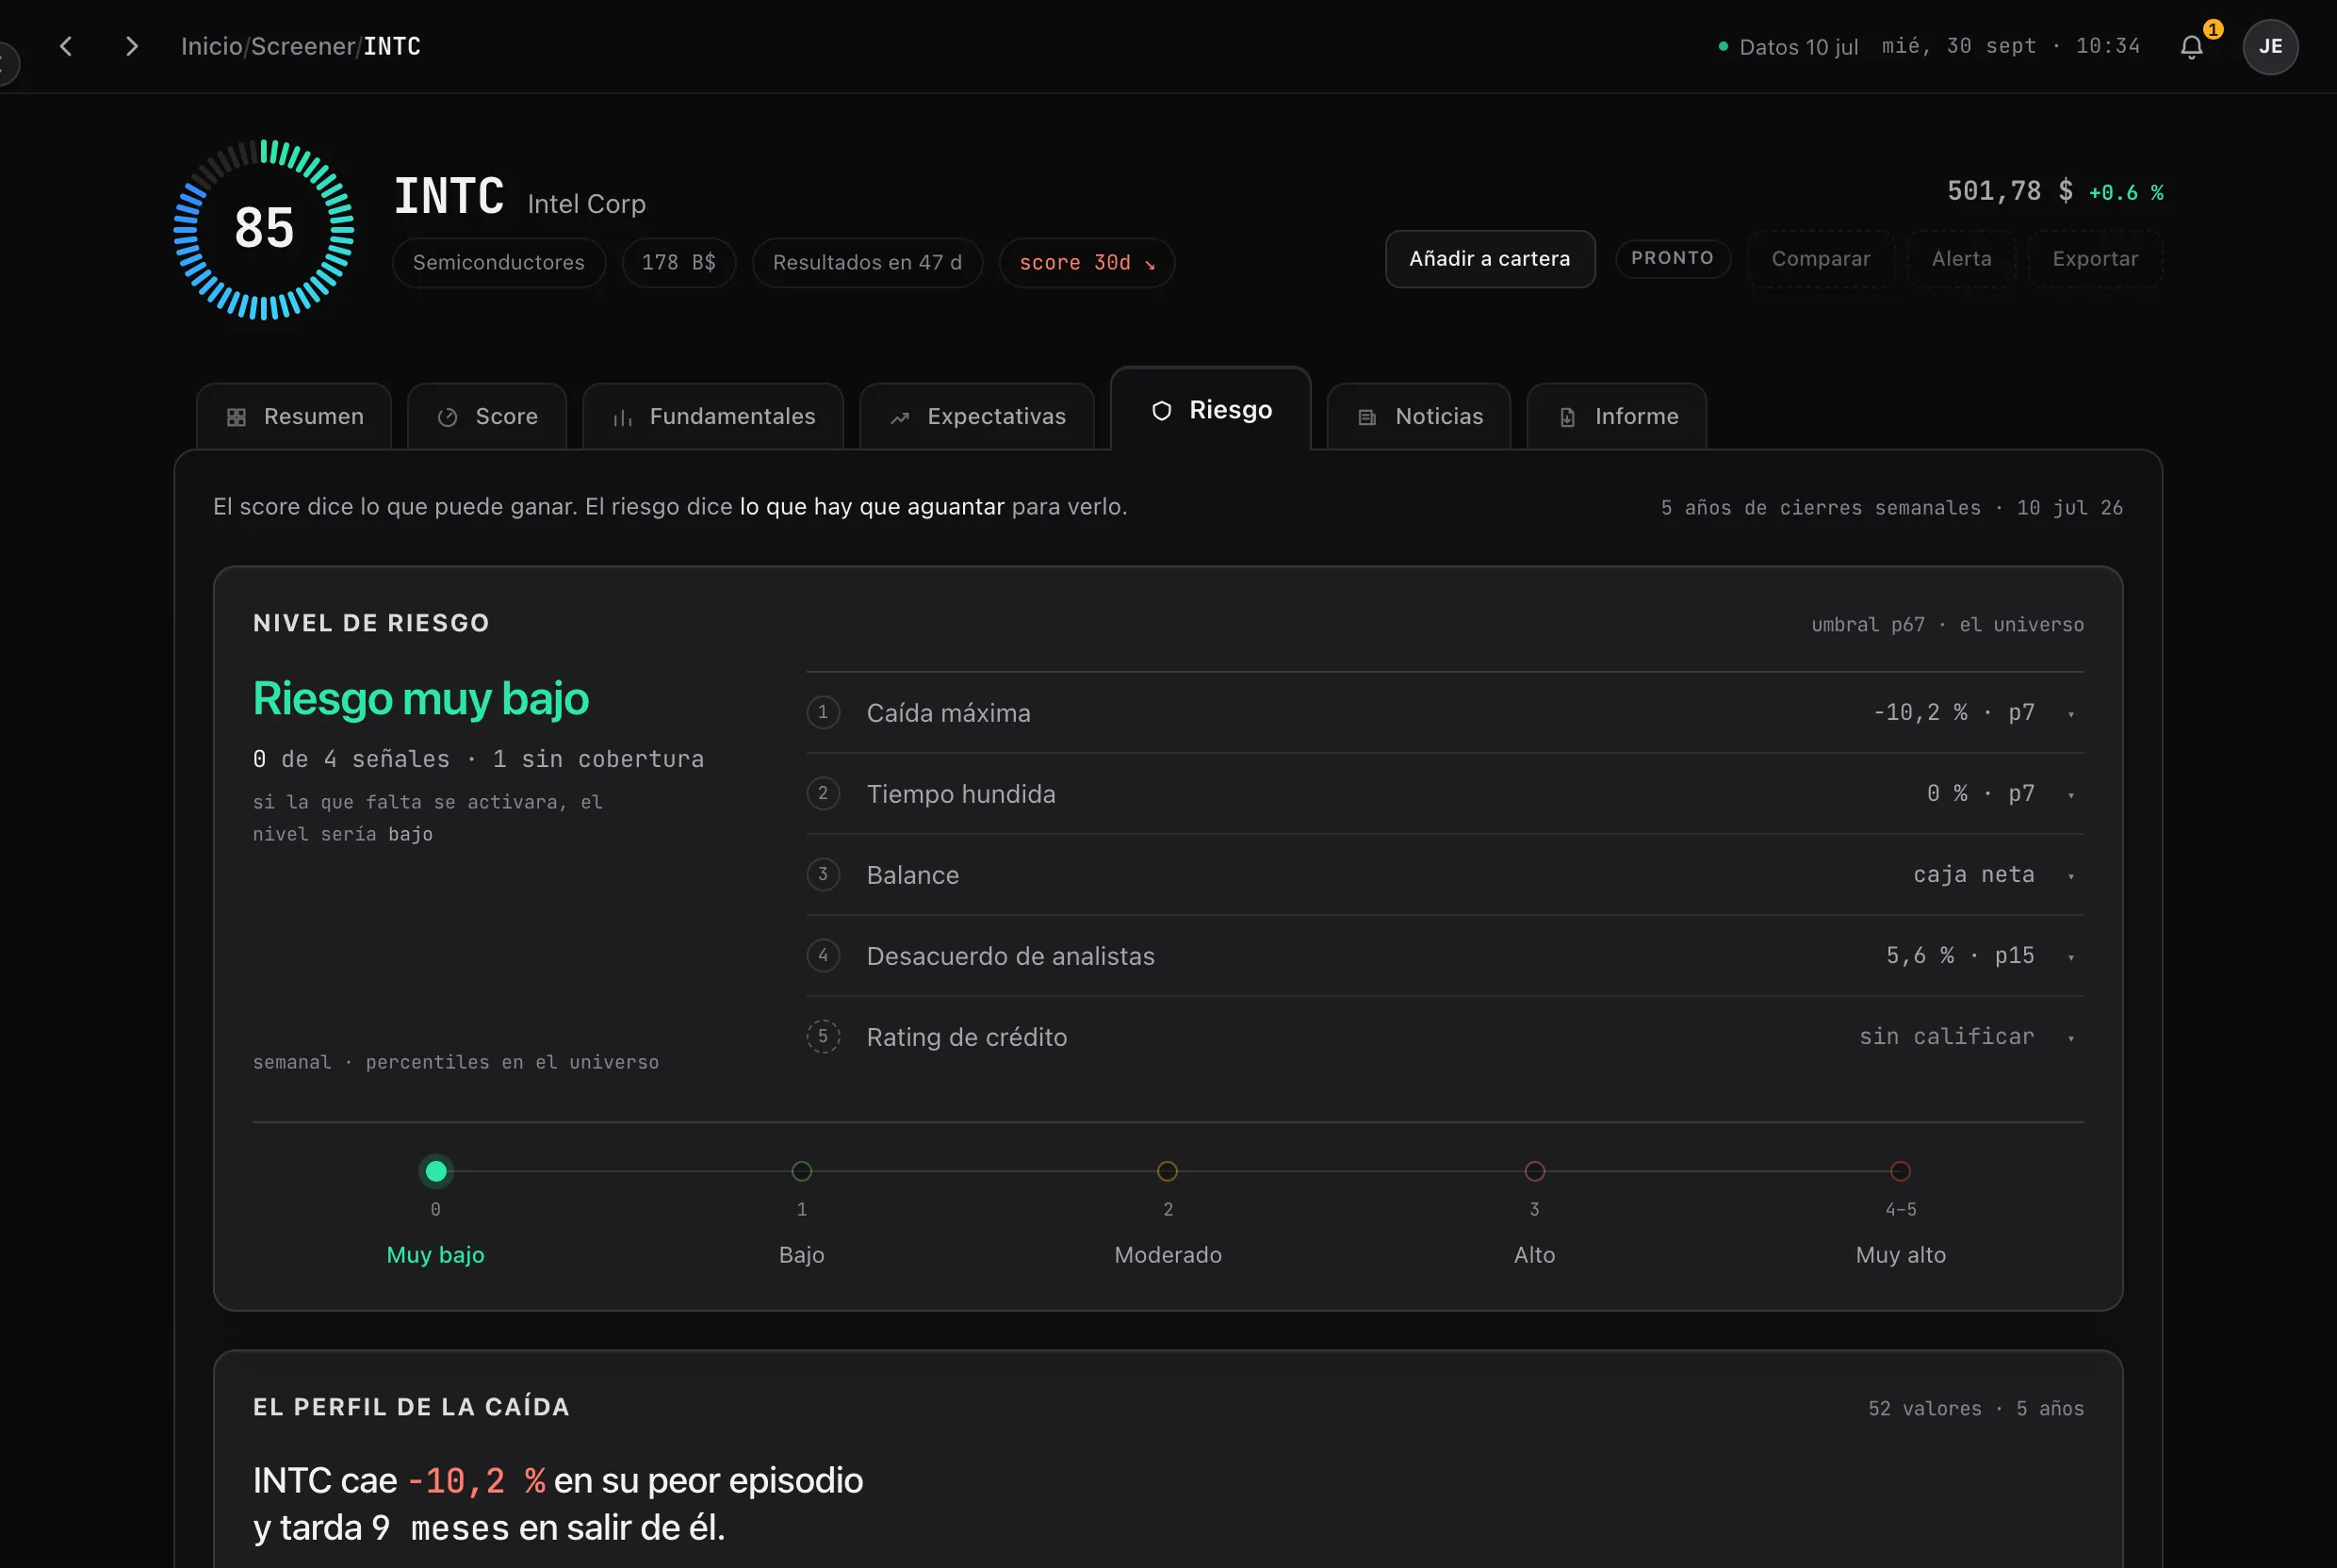
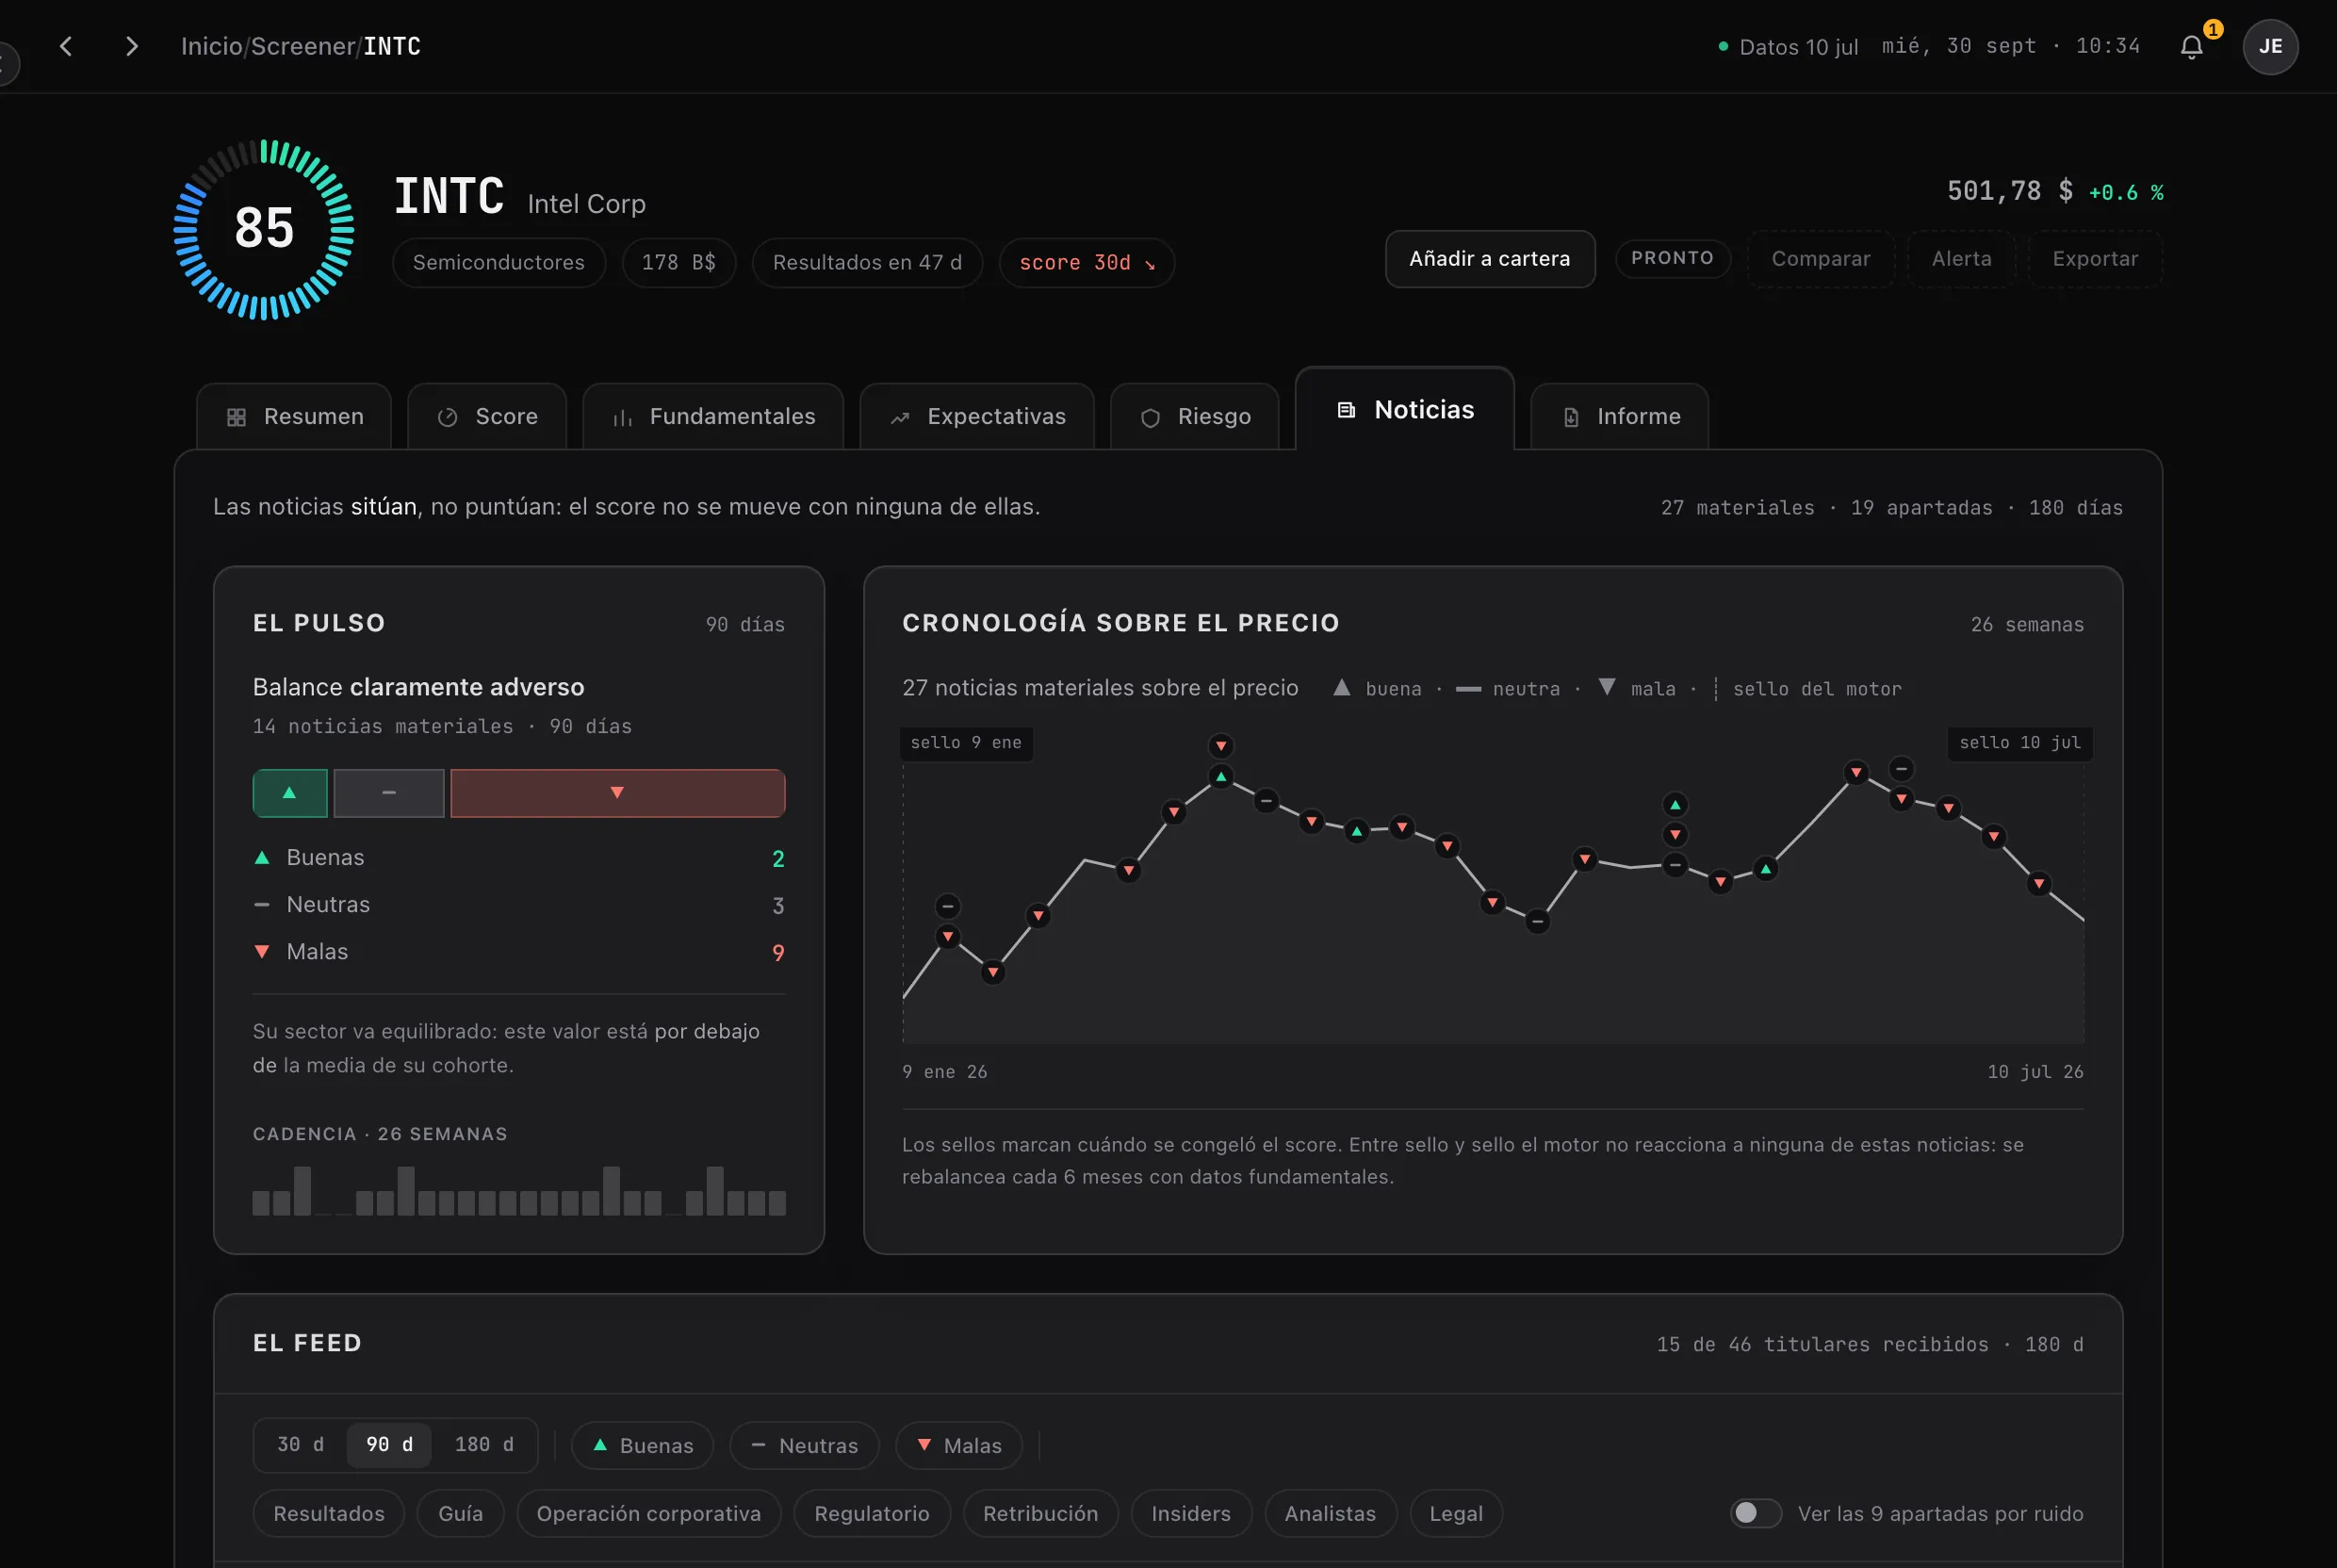
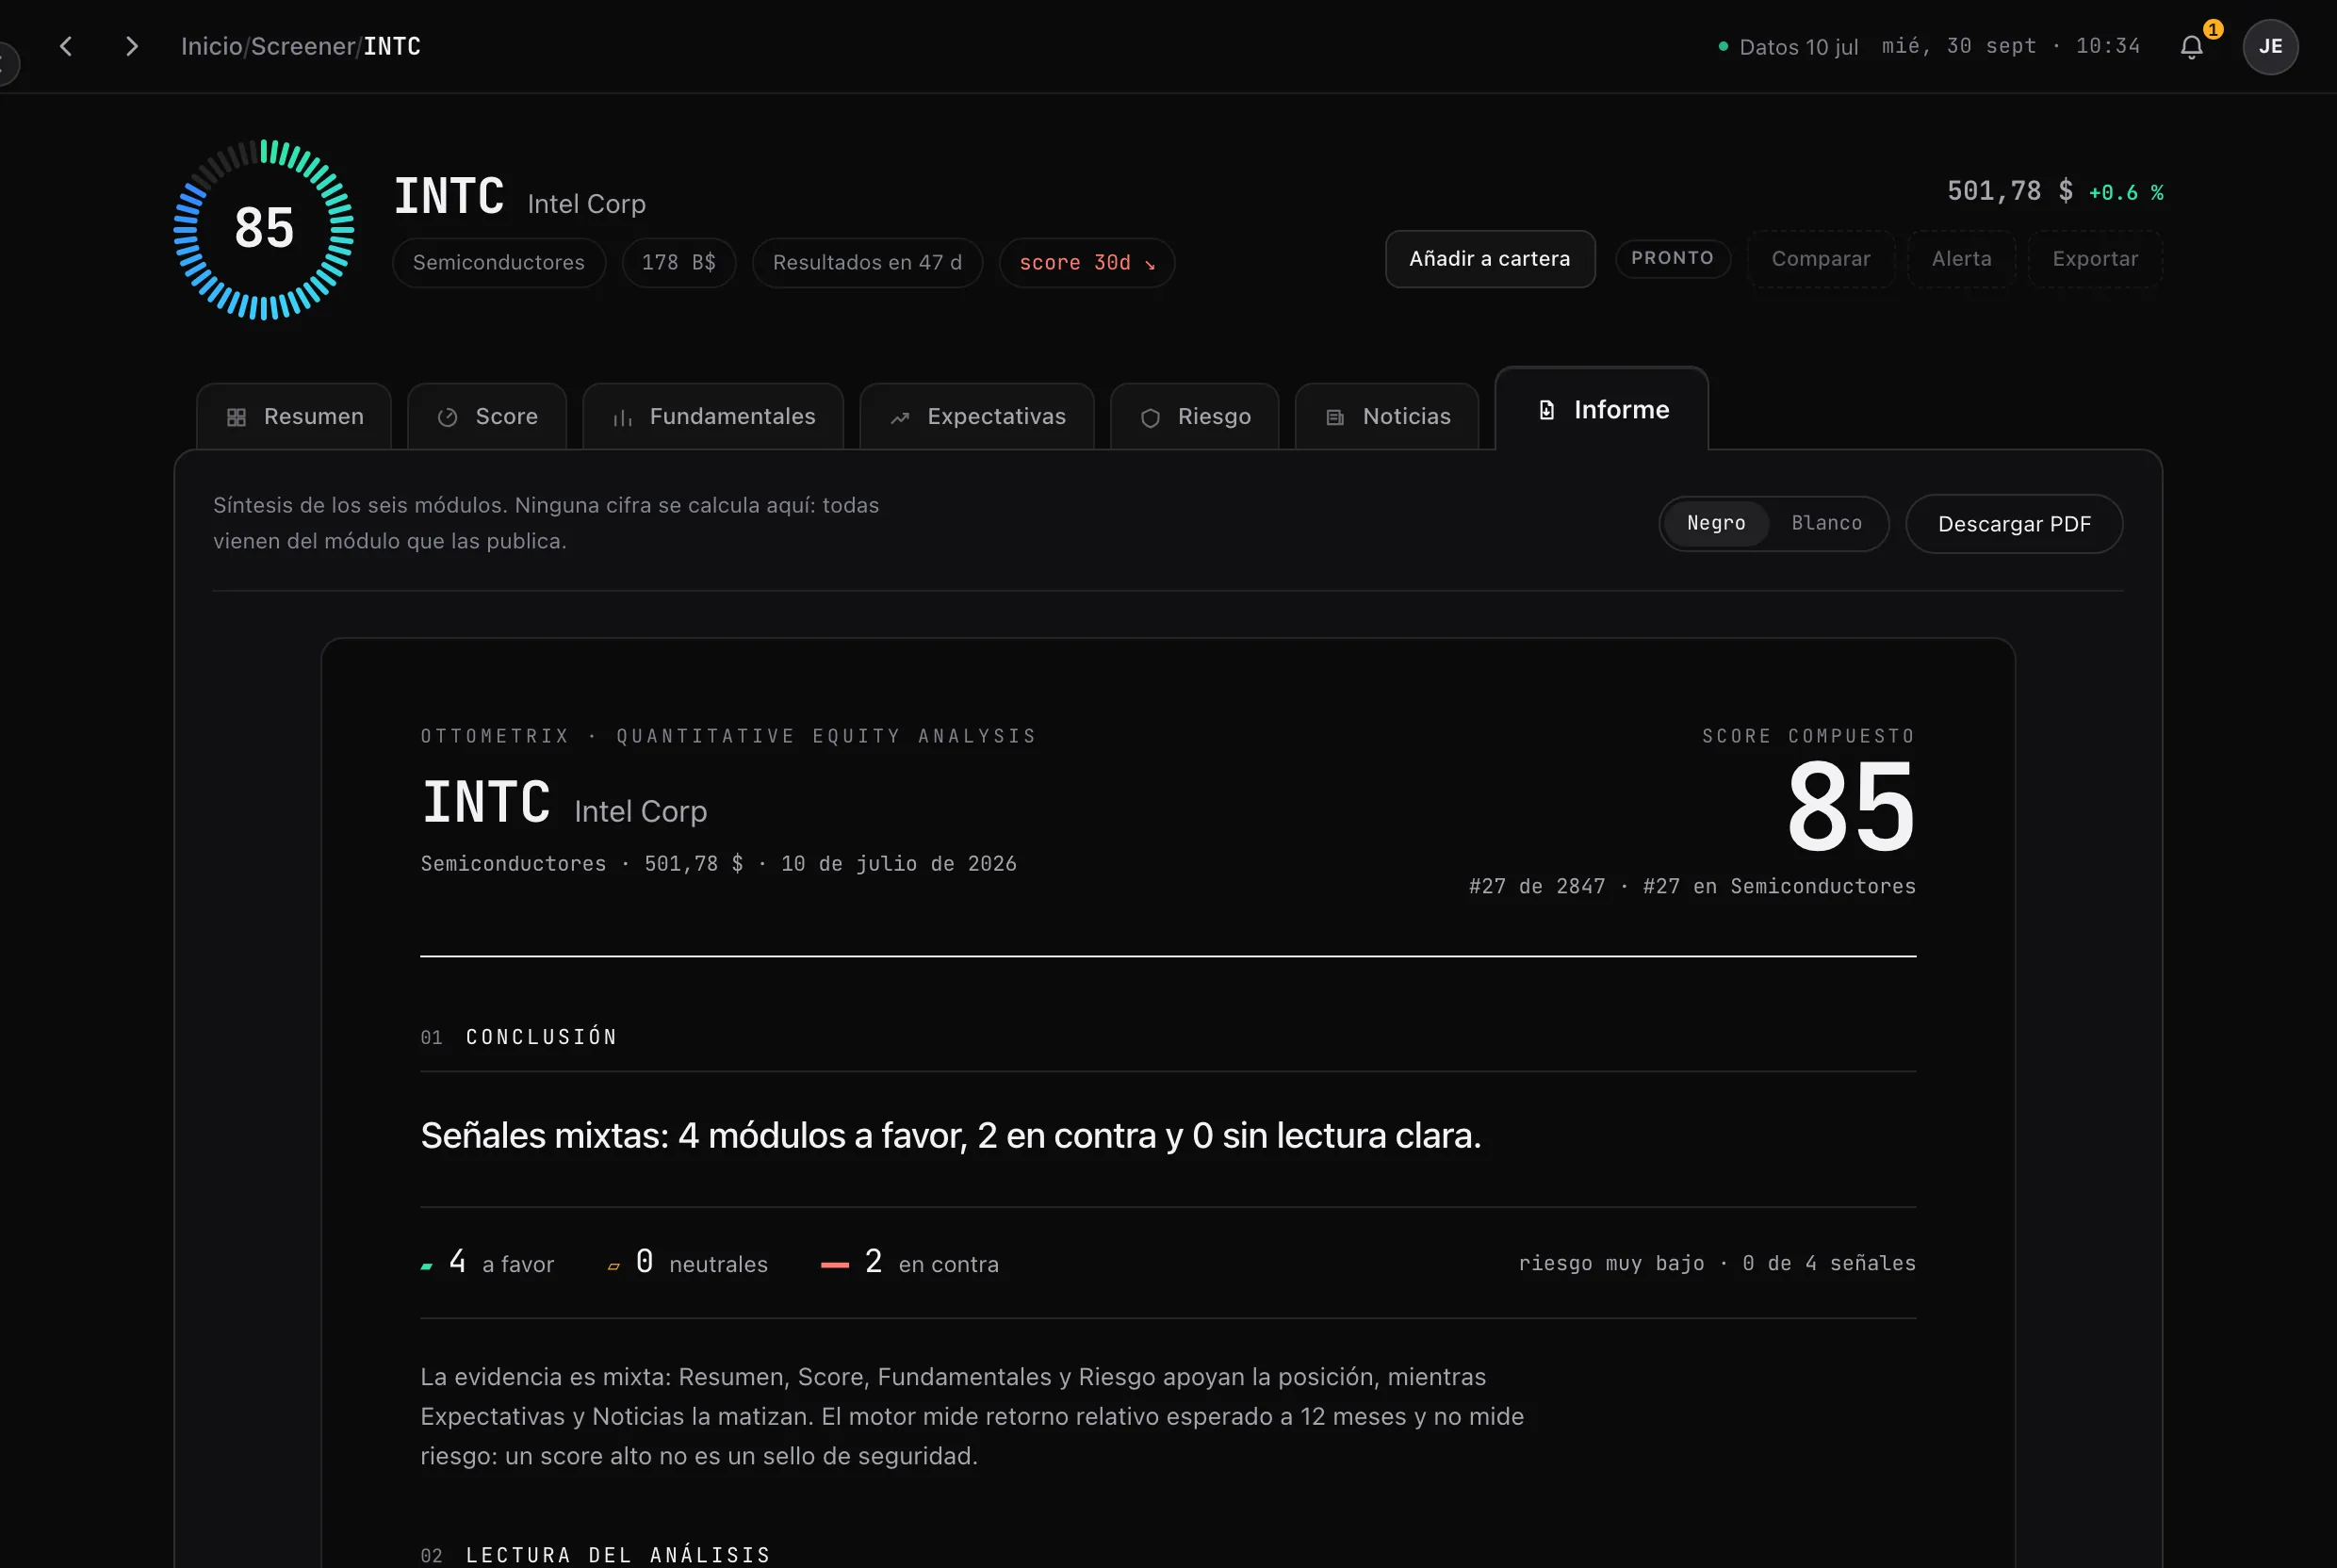
01 / 10Stock file · INTC — Summary
HOW IT WORKS
- Data13,330 tickers from EODHD, delisted companies included
- UniversePrice ≥ $5, market cap ≥ $200M, no financials; all inputs or out
- FactorsValue, quality, momentum and asset growth, point-in-time
- ScorePercentiles 0–100, equal weights
- SealRanking frozen with a SHA-256 hash and a date
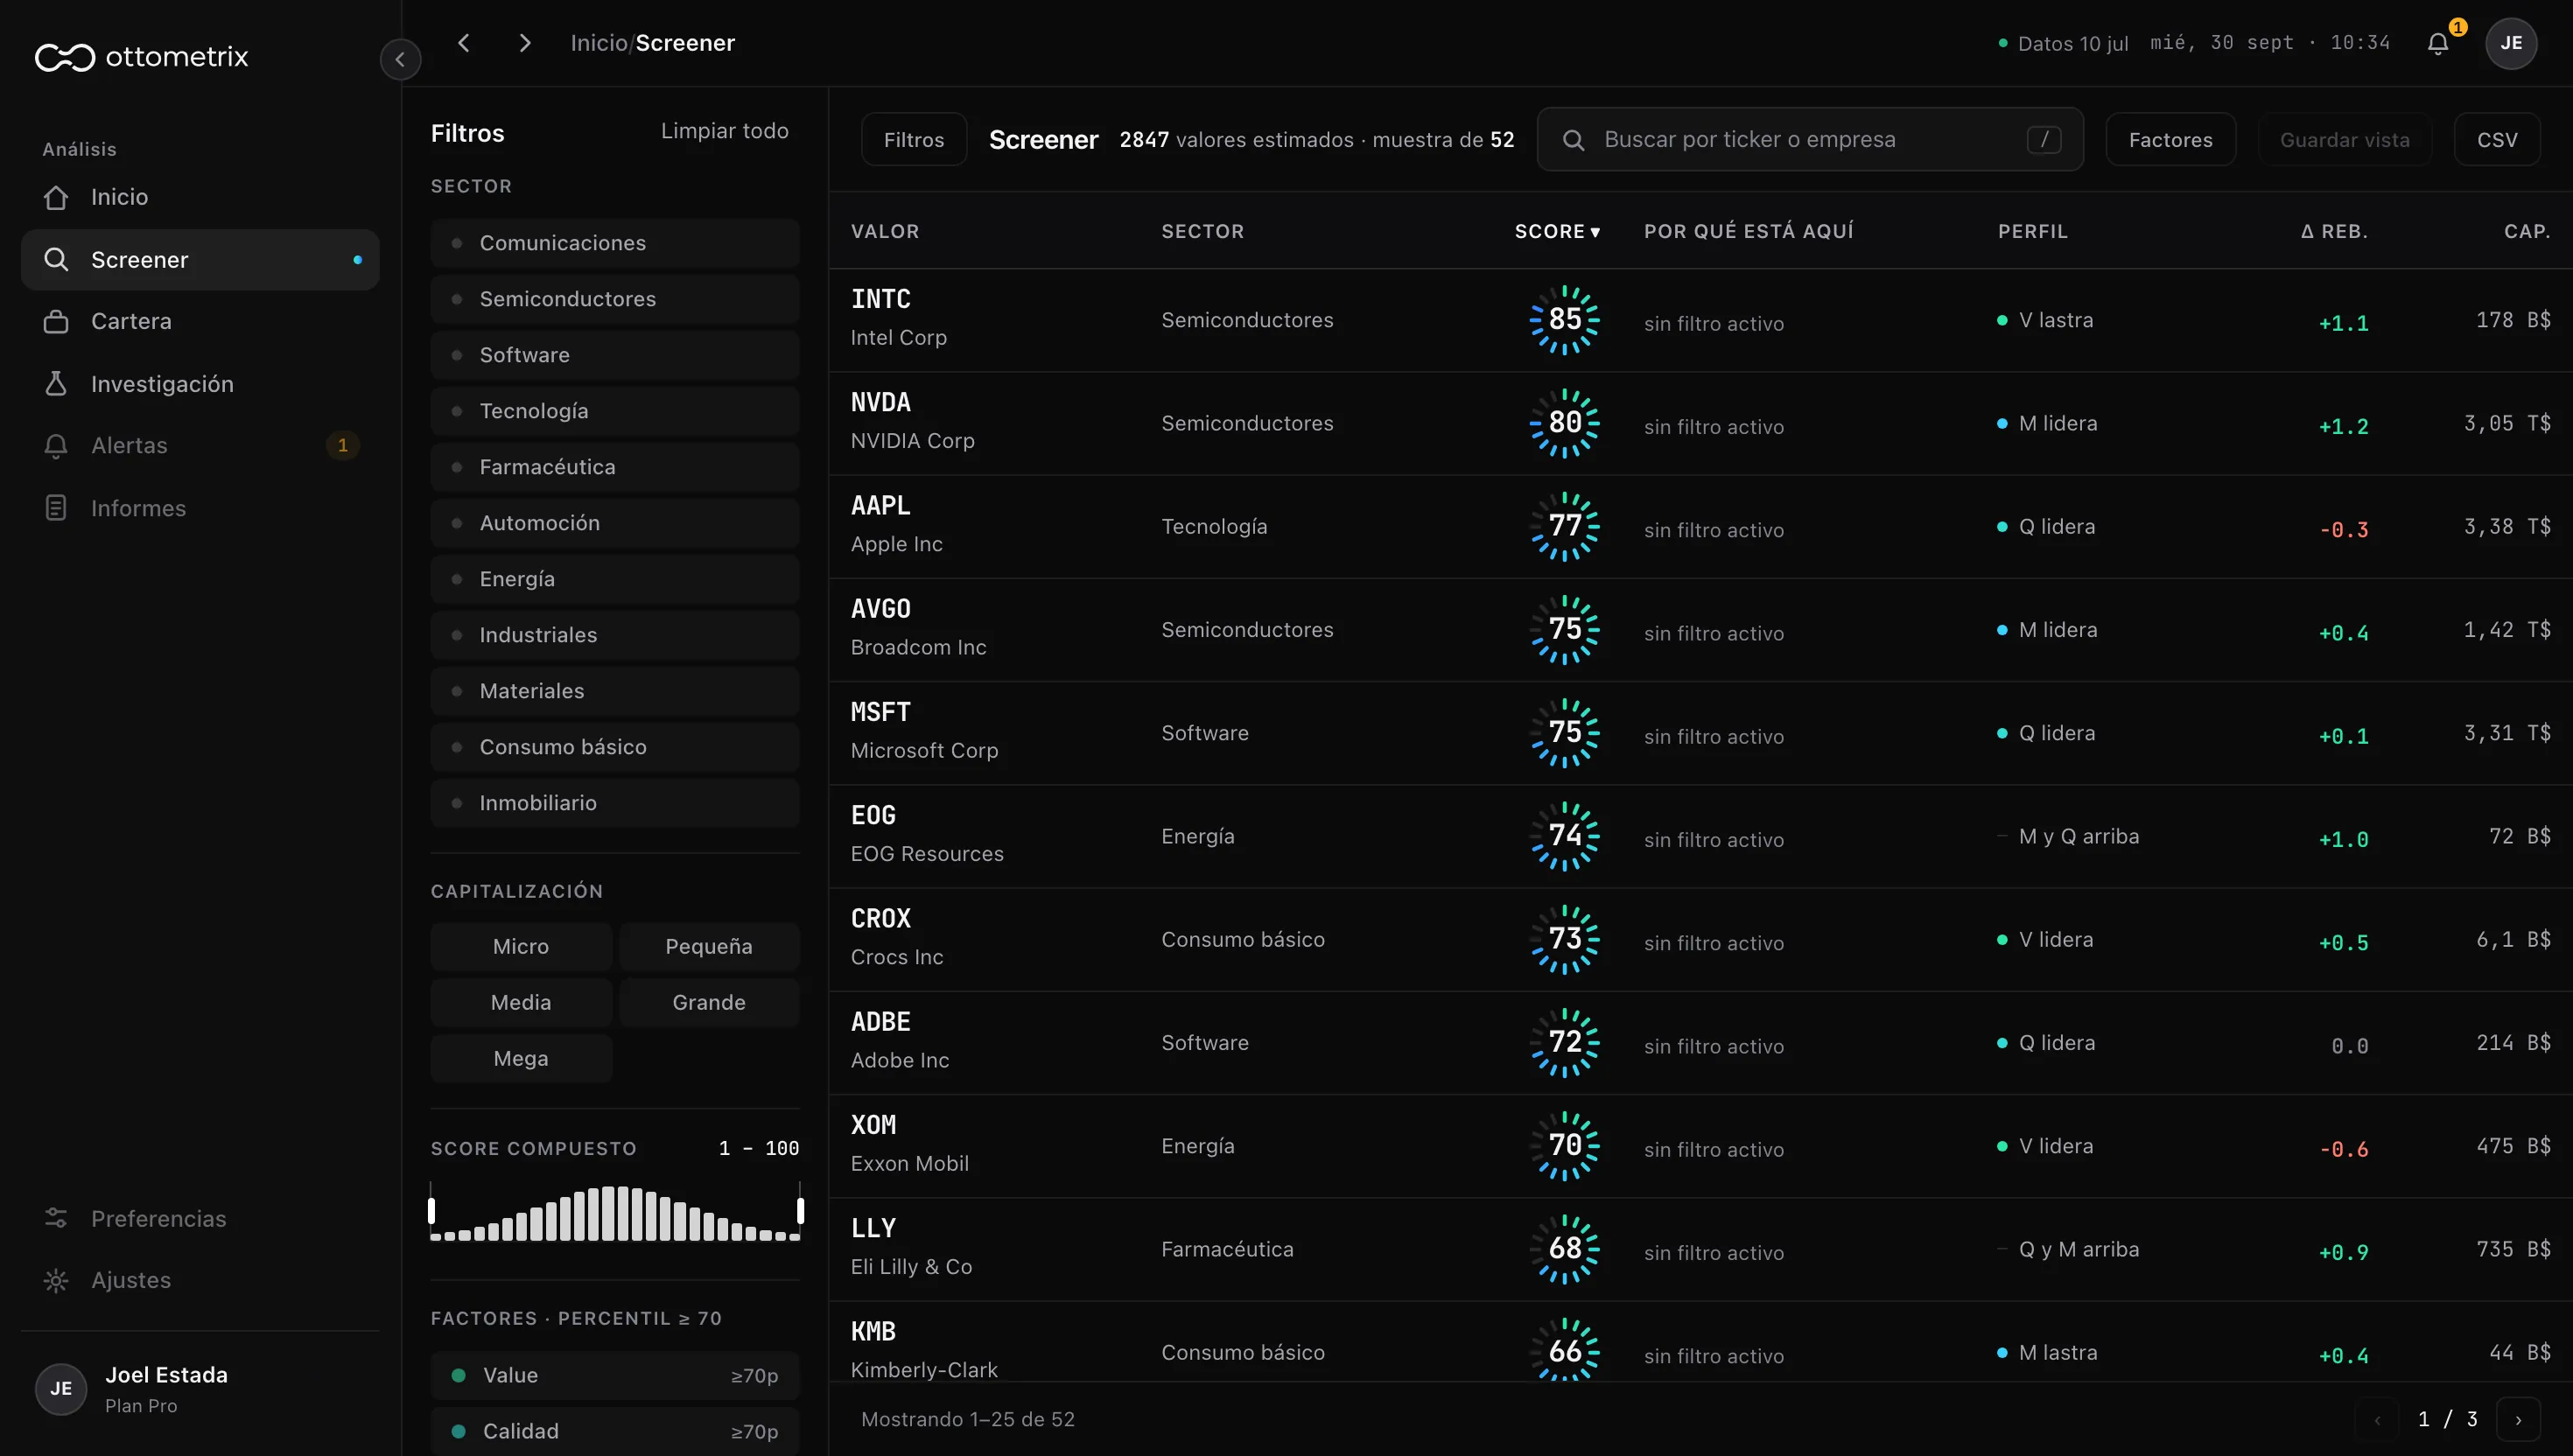
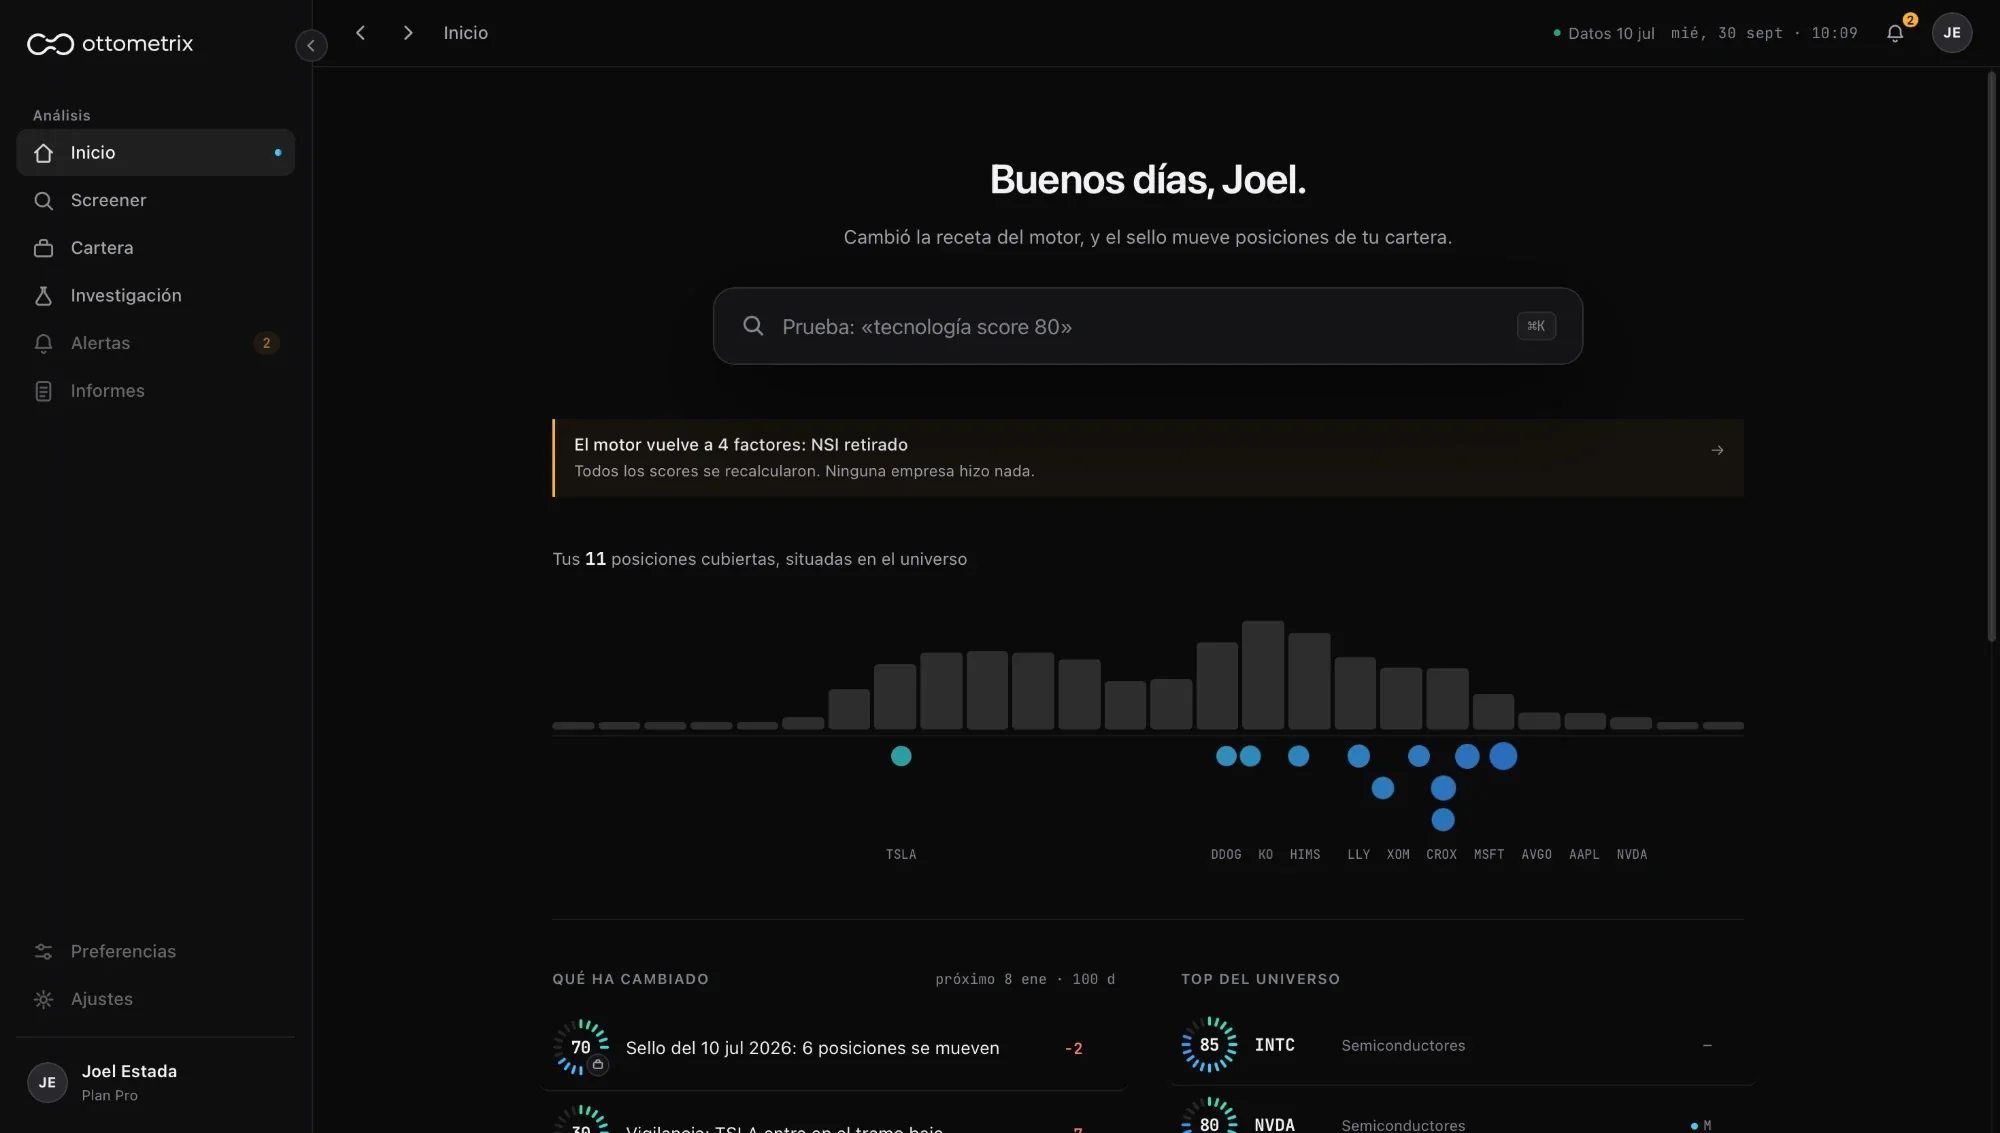
- ProductScreener, stock file, portfolio X-ray
The problem
Retail investors are sold stock-picking tools full of indicators and promises. More metrics do not mean more accuracy: most published factors disappear once you remove micro-caps, look-ahead data or survivorship bias.
I wanted an engine that uses the minimum number of factors that still hold out of sample — and that is honest about what it cannot prove.
The engine
Every six months the engine ranks the investable US market on four academic factors, each turned into a 0–100 percentile and weighted a quarter. The weights were fixed before looking at the data and have never been optimised.
- ¼ValueEBIT / enterprise value
- ¼Qualitygross profitability (Novy-Marx 2013)
- ¼Momentum12-1 month return
- ¼Asset growthyear-on-year change in total assets, inverted
- Strict point-in-time: a filing counts from its date + 1 business day; nothing is imputed
- No survivorship bias: delisted companies stay in, with delisting returns (Shumway 1997)
Validation
Every experiment is pre-registered with its hypothesis and pass threshold before it runs, and every run is logged so the Sharpe ratio can be deflated for multiple testing. Thirteen training cohorts (2018–2024) decide; a three-cohort holdout can be looked at only once.
Twelve improvements were proposed. None survived. The one that passed in sample failed on the untouched holdout in all three cohorts, and was reverted.
Information coefficient of the engine
Test record · 13 tests
Each change to the engine was tested against the baseline on the training cohorts, with a pass rule fixed in advance.
13 · H1.3 holdoutREVERTED
The same change, on the untouched holdout
Worse in 3 of 3 cohorts
The engine runs on the original four factors. It does not claim proven alpha, and the product says so.
The product
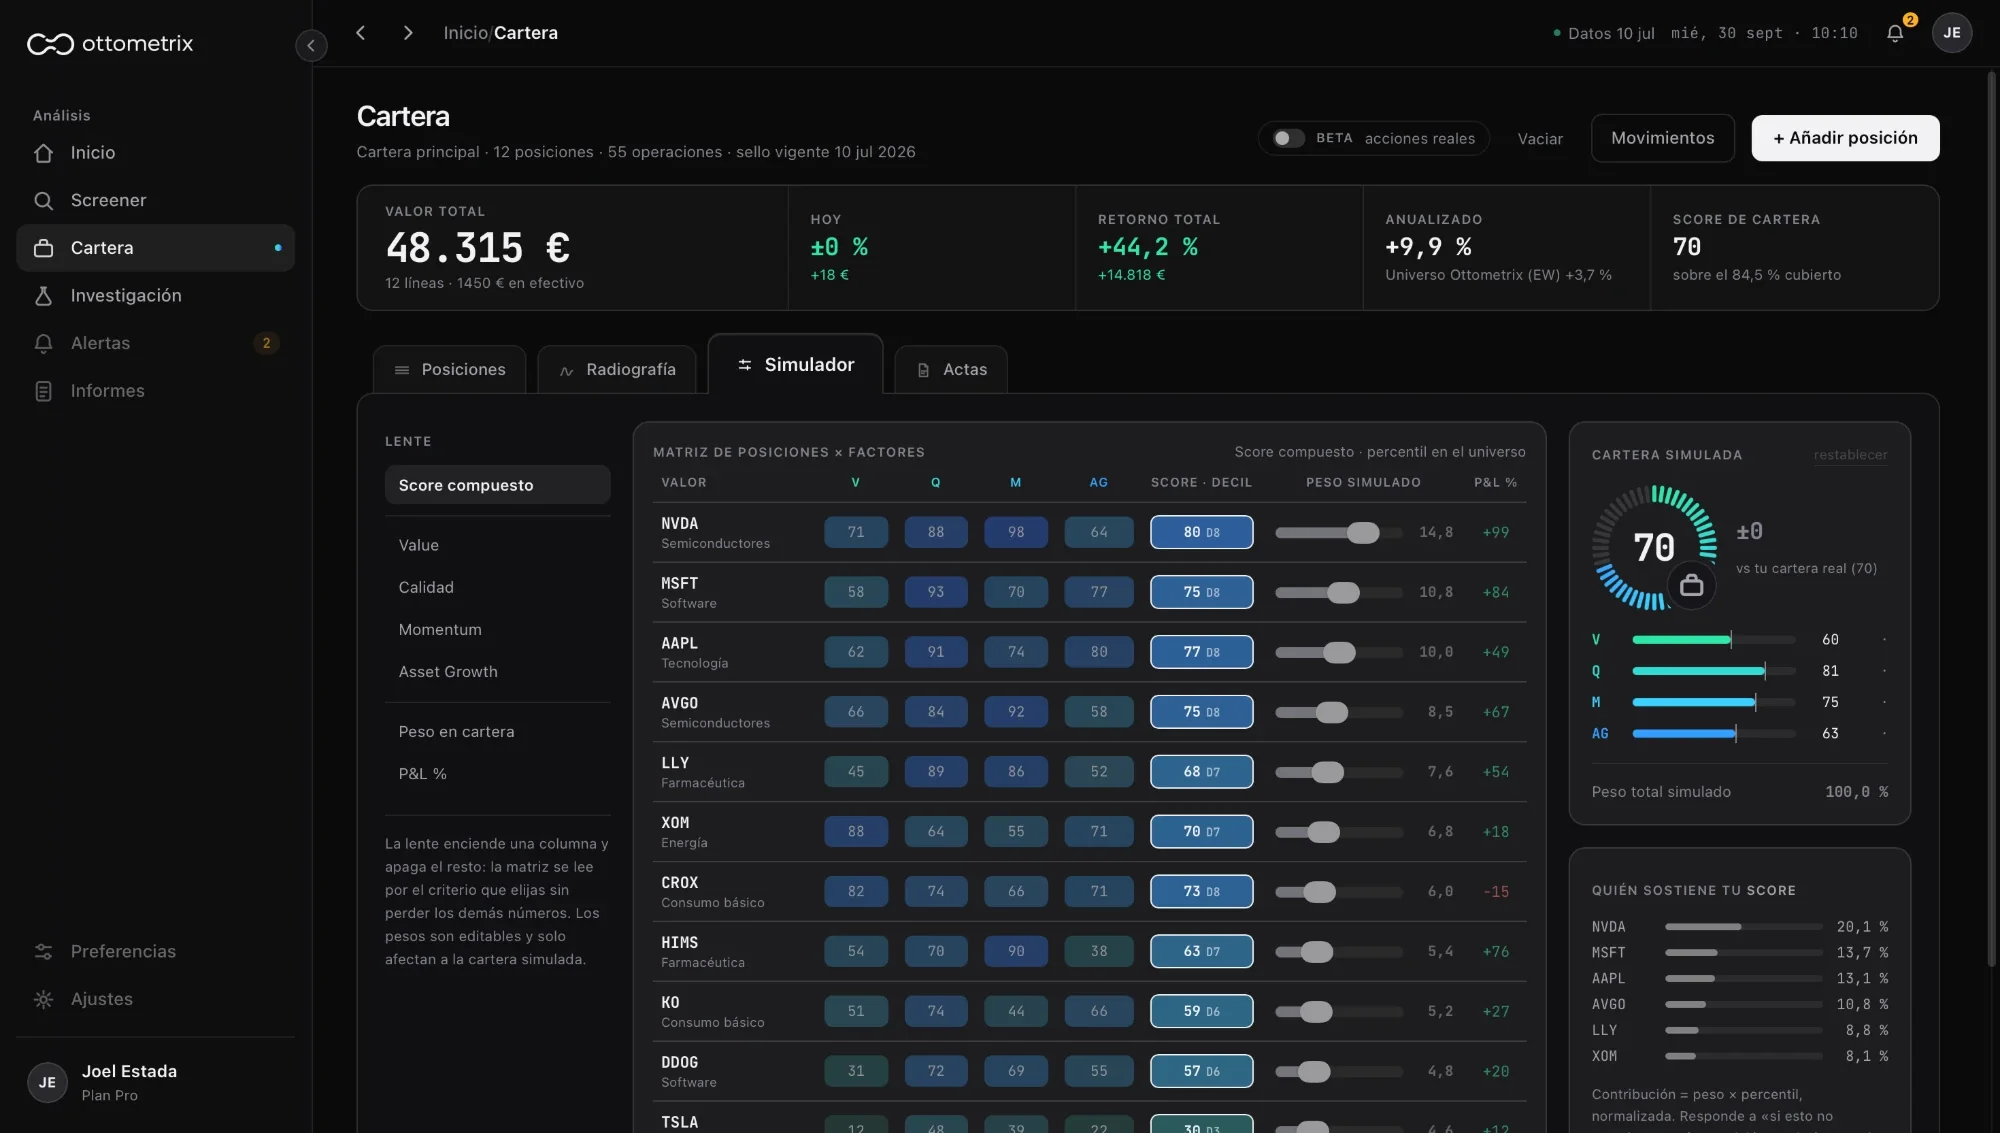
The SaaS turns the ranking into something an investor can use without a statistics degree: a screener over the whole universe, a file for every stock that shows what happened after each past score, and a portfolio X-ray that reads your holdings against the engine.
Pricing is designed (free, €15 and €30 a month, and institutional) and the marketing site embeds the real app instead of mock-ups.
Bill of materials
| Engine |
|
|---|---|
| Product |
|
| Method |
|
What I learned
A previous attempt ran 463 iterations and overfit. Ottometrix exists because of that lesson: fewer factors, fixed weights, a holdout you only get to use once.
Data engineering is most of the work: point-in-time filings, delistings, share counts, sector labels.
Saying “this does not work” with evidence is a result, not a failure.
We analyze. You decide.
Ottometrix is private while in development. I am happy to walk you through the current SaaS.